
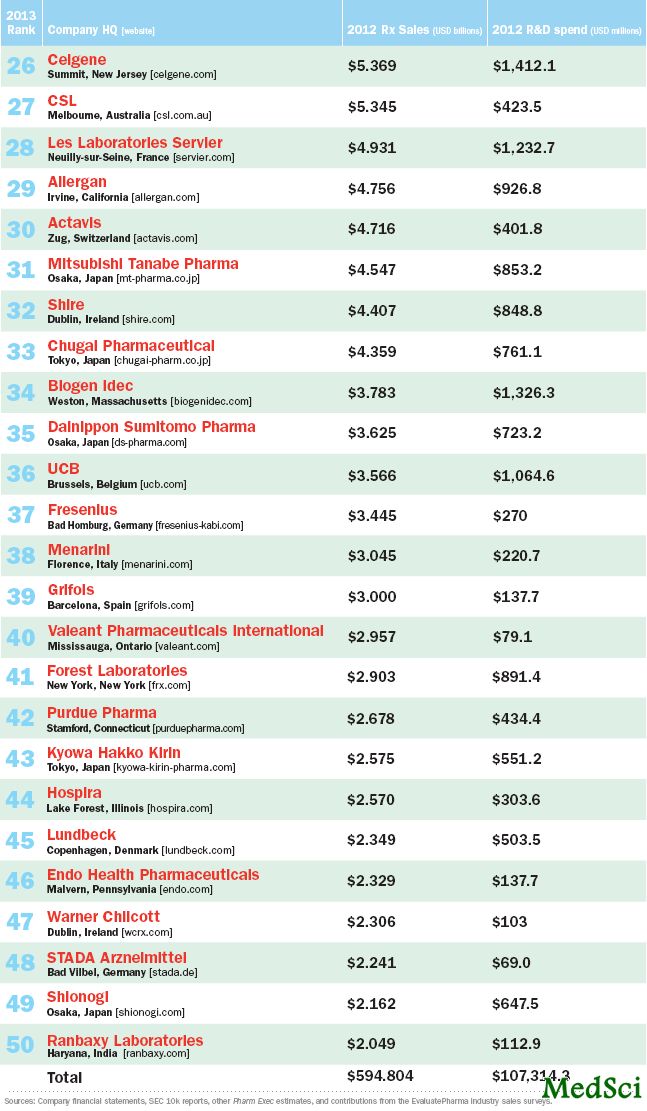
全球制药企业排行榜 (2013 Pharm Exec top50)
2013-07-05 MedSci MedSci原创
MedSci注:每年一度的PharmExec 全球制药排行榜,概述在上一年度全球制药企业的表现,包括业绩表现,以及研发的投入状况。同时,有哪些可能是新兴的领域。这里摘录如下:Disruptive market change in the biopharmaceutical industry is a given—but individual company performance is ris
MedSci注:每年一度的PharmExec 全球制药排行榜,概述在上一年度全球制药企业的表现,包括业绩表现,以及研发的投入状况。同时,有哪些可能是新兴的领域。这里摘录如下: Another enduring truth is the
startling lack of concentrated market power in pharmaceuticals. What has
not changed since we
began compiling the Pharma 50 in 2000 is the top 10 still
comprise less than 50 percent of the global market (their 2012 global
share is 42 percent, compared to 43 percent in 2007). Other
industries less reputationally vulnerable than pharma see much
more concentration at the top; certainly this is true in the
payer community, where governments increasingly hold sway. Even
in the patent protected market, the core competency of Big
Pharma, the top 10 players' share remained at 52 percent in 2012,
the same level it was in 2007. The bottom line? For pharma,
business is still an intensely competitive game of chance. —William Looney, Editor-in-Chief
To identify what's driving the numbers, we examined the top 50 as a group and in comparison to companies outside the top 50.
We see five trends shaping current sales performance across the geographies where the pharma group competes:
For the 13 companies,
year-on-year performance for 2012 amounted to a close to 10 percent
contraction in revenues against
2011. Excluding these companies, we see that US growth
performance for the remainder of the top 50 was actually slightly higher
compared to last year. The 13 companies thus represent the
brunt of the loss to the industry, with the remaining companies
in the top 50 performing fairly well. The top line in Figure 1
represents the growth of all other companies with revenue in
the United States, comprised of over 600 companies outside of
the top 50. The growth in these companies is significantly more
than the top 50, and includes companies with extremely varied
portfolios, including branded products and generics. In many
ways it is not surprising to see such growth, given that they
are starting from a smaller base of revenues than the top 50
and that some are posting new revenues from newly launched
generics, at the expense of those facing patent expiries.
Disruptive
market change in the biopharmaceutical industry is a given—but
individual company performance is rising to the
occasion through efficient deployment of a still considerable
inventory of product, process, and knowledge assets. If anything,
uncertainty has helped push the Big Pharma players to put their
own houses in order, chiefly by slowing the hemorrhage in
R&D costs, which has deflected the negatives from the
transformation of healthcare as a budget buster—for both households
and governments. True to form, Pharm Exec's 2013 ranking
of the top 50 pharma companies worldwide finds few variations from last
year, with the notable exception being
the Rx success of global generic firms as they benefit from
innovative portfolio diversification: Teva is nipping at the heels
of Eli Lilly, at just one slot short of the top 10, while
Ranbaxy joins the Pharma 50 list for the first time. Overall, however,
only a relatively small set of companies—BMS, in particular,
which drops to 17th in global Rx sales, from 11th last year—have
been affected by the rush of patent expiries, contributing
disproportionately to the weaker industry sales performance over
the past several years.
Perhaps most
notable is the contraction in the US market—the first in more than 50
years. This contraction comes not only
from several patent expiries of billion dollar
blockbusters—including Plavix, Seroquel, Lipitor, and Zyprexa—but also
from
increased scrutiny by payers for reimbursement and regulators
for approval. The negative growth is driven by a few companies,
each of whom had exposure to over $5 billion in revenue loss
due to patent expiration of their major products. In the United
States, there were 13 such companies in the five year period of
2008 to 2012: Pfizer, GSK, Takeda, Merck, J&J, BMS, AZ, Novartis,
Sanofi, Lilly, Forest, Boehringer-Ingelheim, Eisai, and Roche.
Thus, in Figure 1, we see that year-on-year growth for the
entire market was negative for the first time.
Figure 1: Performance of US pharma market by company type.
The second trend is the impact of the recession in Europe, where we see a zero growth situation rather than an outright contraction. The lagging performance of the pharmaceutical industry in the five major EU countries is due more to austerity and government fiscal issues rather than inherent company dynamics. In these countries, patent expiration does not have as striking an effect on company sales after loss of exclusivity (LOE) because the branded product's retention of sales is much higher compared to the United States. Many companies retain significant sales from off-patent products in the EU five as government reimbursement treats off-patent brands and generics similarly. Nonetheless, policy changes in the last five years have changed this pattern substantially and there is significant reduction in sales for off-patent brands as well as steeper erosion of new patent expiries.
 Figure 2: Performance of EU pharma market by company type. |
 Figure 3: Performance of Japan’s pharma market by company type. |
The relatively higher growth in Japan for these five against their global norm was attributable in part to better performance of new launches and to the lower price cuts applied to protected brands under Japan's current NHS price control system. The Japanese government imposes a 5 to 6 percent price cut every other year, in April. In 2010, a revised policy provided lower price cuts for protected branded products, and steeper cuts for off-patent products and generics, amplifying the impact of more recent patent expiries and providing a boost to innovative companies, many of whom are responding by launching products in Japan earlier in their global launch sequence than they had in the past. Vaccines are another bright spot, aided by more government support for immunization and access.
Figure 4: The performance of the companies within the top 50 compared with performance of all the other companies selling in emerging markets. |
In Figure 4, we see the performance of the companies within the top 50 compared with performance of all the other companies selling in emerging markets. The top 50 companies primarily are selling innovative brands along with branded generics and annual growth in these two segments has been close to 10 percent over the past five years. Companies outside of the top 50 are primarily selling branded generics (non-original brands that have some unique branding and where the company marketing the products is not the originator) and regular generics. The "other products" category includes OTC medicines as well as products like homeopathic or traditional Chinese medicines as well as vaccines. For companies outside of the top 50, the growth in all these segments has been incredibly strong, although the innovative brand growth is off a smaller base.
 Figure 5: More new molecular entity drugs were approved in the United States last year than in any year since 1999. |
Science dividend
 |
The right model?
 |
Strategic choices aside, the extent and pace of future growth depends on a great number of factors including if and how those who pay for pharmaceuticals around the world make provisions to afford the wave of innovations that is coming from researchers' greater understanding of molecular biology and the genetic origins of disease. The signs of this rebound are there to see, so don't get too distracted by the industry-wide slowdown currently underway—this is one cycle that, like all others in the industry, will eventually play itself out.
作者:MedSci
版权声明:
本网站所有注明“来源:梅斯医学”或“来源:MedSci原创”的文字、图片和音视频资料,版权均属于梅斯医学所有。非经授权,任何媒体、网站或个人不得转载,授权转载时须注明“来源:梅斯医学”。其它来源的文章系转载文章,本网所有转载文章系出于传递更多信息之目的,转载内容不代表本站立场。不希望被转载的媒体或个人可与我们联系,我们将立即进行删除处理。
在此留言


#Pharm#
61
#企业#
64
#排行#
67
#制药企业#
61